
Interactive Consultation Maps
Collect location-based feedback from residents with pin-drop maps that make spatial planning feedback intuitive and accessible. Let the community tell you exactly where they care about and why — turning geographic feedback into actionable planning insights.
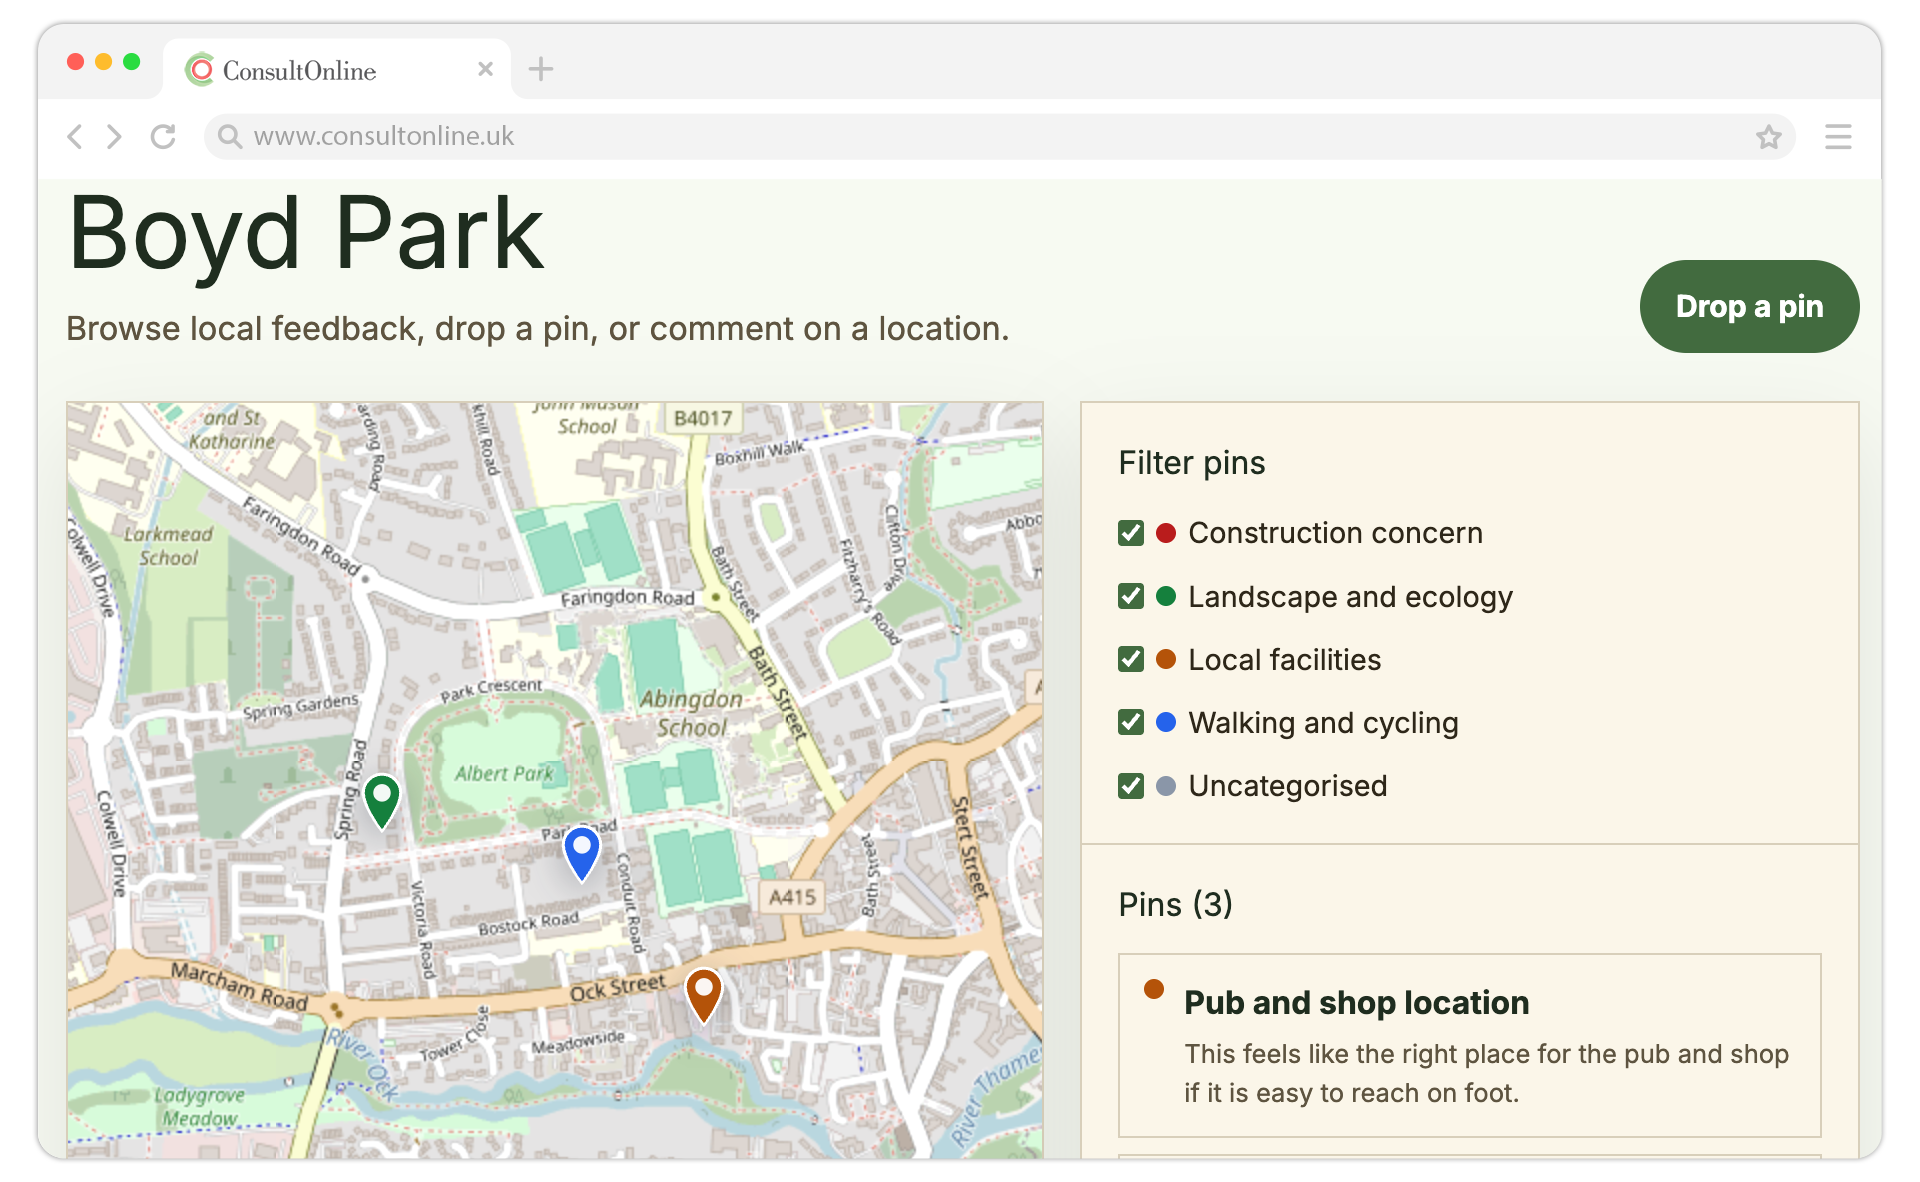
Pin-Drop Feedback
Residents click anywhere on the interactive consultation map to drop a pin and attach their comment. No forms to fill, no grid references to look up — just tap the spot that matters and start writing. Spatial planning feedback has never been more accessible.
Category Filtering
Organise pins by category — traffic, green space, housing, noise, heritage, accessibility, and more. Filter the map to isolate specific concerns and build a clear picture of community priorities by theme and location.
Comment Threads
Each pin becomes a discussion point. Other residents can upvote, reply, and add context to existing pins on the map — building a rich, threaded conversation tied to a real-world location on the planning application map.
The Spatial Advantage
Why location-based feedback changes consultation
Traditional public consultation relies on written submissions, open-text forms, and emailed letters. While these methods capture what people think, they almost entirely miss where those concerns relate to. A resident might write “I’m worried about increased traffic” — but without spatial context, planners cannot tell whether they mean the main junction, a residential side street, or the school drop-off zone. Location-based consultation solves this by tying every comment to a precise point on the map, giving planning officers the geographic detail they need to make informed decisions.
Pin-drop feedback is also dramatically more engaging than traditional forms. Community mapping feels natural — residents already use maps every day on their phones to navigate, search for places and share locations. When you present a familiar interactive consultation map instead of a blank text box, participation rates climb. Residents who might never write a formal representation will happily drop a pin and type a sentence. The visual, tactile nature of map-based feedback lowers the barrier to participation and draws in voices that are typically underrepresented in planning consultations.
For planning consultants, the benefits compound as responses accumulate. Instead of reading hundreds of individual submissions and manually trying to identify spatial patterns, geographic feedback organises itself. Clusters of pins reveal hotspot areas of concern. Category filters let you isolate traffic comments from green space comments in a single click. Heatmap consultation views show density at a glance. The result is a richer, more nuanced understanding of community sentiment — grounded in place, not just opinion.
How It Works
From boundaries to heatmaps in three steps
Set Your Boundaries
Draw the consultation boundary directly on the map using our boundary drawing tools. Define the geographic area residents can place pins within — whether that is a single development site, a neighbourhood plan area, or an entire town centre. Configure your pin categories, choose colour coding, and set moderation preferences before you publish.
Residents Drop Pins
Community members visit your consultation microsite, navigate the interactive map and drop pins at specific locations. They select a category for their feedback, write their comment and can upload supporting photos. Other residents can view existing pins, upvote comments they agree with and add replies to build threaded discussions around each location.
Analyse & Export
See feedback density with heatmap overlays that reveal spatial patterns at a glance. Filter by category to isolate specific themes. Identify hotspots of concern, export spatial data as GeoJSON or CSV for your reports and GIS software, and use the insights to produce evidence-based planning recommendations.
See interactive maps in action
Book a short demo and we will walk you through setting up a pin-drop consultation map for your next project — from boundary drawing to heatmap export.
Capabilities
Powerful spatial feedback tools
Everything you need to run effective location-based consultations, from map setup and moderation to analysis and data export.
Analysis & Reporting
From individual pins to spatial insights
Every pin dropped on your interactive consultation map is a data point. As responses accumulate, individual comments transform into spatial patterns. ConsultOnline’s heatmap visualisation mode aggregates pin data into density layers, instantly revealing where feedback is concentrated. A housing development consultation might show heavy clustering around a proposed access road; a neighbourhood plan might reveal that residents overwhelmingly value a particular green corridor. These heatmap consultation views make patterns visible that would take hours to extract from written submissions.
Category filters are where spatial analysis becomes truly powerful. With a single click, planners can isolate pins tagged as “traffic,” “noise,” “green space,” “heritage,” “accessibility,” or any custom category you define. This lets you build thematic maps of community concern — showing, for example, that traffic worries concentrate around the northern junction while noise concerns cluster along the southern boundary. The ability to toggle categories on and off transforms your consultation map into a dynamic analytical tool.
When it is time to report, ConsultOnline’s export tools ensure your spatial data works seamlessly with professional GIS software. Export pins as GeoJSON for use in QGIS, ArcGIS, or MapInfo, or download as CSV for analysis in Excel or Google Sheets. Every export includes coordinates, categories, comment text, timestamps, and vote counts — giving you a complete dataset ready for inclusion in planning statements, committee reports, and community engagement summaries.
Feature Deep Dive
Map features in detail
A closer look at the tools that make ConsultOnline’s interactive consultation maps the most effective way to gather spatial planning feedback.
Pin-Drop Comments
The core of location-based consultation. Residents tap or click any point on the map to place a pin, then write their comment in a simple pop-up form. Each pin records precise coordinates, a timestamp, the selected category, and the full comment text. Pins can also include photo attachments, giving residents a way to show as well as tell.
Category & Colour Coding
Define custom categories for your consultation — traffic, noise, green space, heritage, accessibility, housing, or anything relevant to your project. Each category gets a distinct colour, so the map is immediately readable at a glance. Residents select a category when they drop a pin, and planners can filter the map to show only the categories they need.
Heatmap Visualisation
Switch from individual pins to a heatmap overlay to see feedback density across the entire consultation area. Hot zones glow red and orange; quieter areas fade to cool blues and greens. Heatmap consultation views are perfect for committee presentations, planning reports, and identifying areas that need further investigation or targeted engagement.
Boundary Drawing
Define the geographic scope of your consultation by drawing boundaries directly on the map. Residents can only place pins within the defined area, keeping feedback focused and relevant. Boundaries can follow site red lines, neighbourhood plan areas, parish boundaries, or any custom shape you need. Adjust boundaries at any time during the consultation.
Mobile Touch Gestures
Every interactive consultation map is fully optimised for mobile devices. Residents can pinch to zoom, swipe to pan, and long-press to drop a pin — all with the fluid touch gestures they expect from modern map apps. Mobile-first design ensures that residents responding on the go have exactly the same experience as those on desktop.
Data Export & GIS Integration
Export your consultation map data in industry-standard formats. GeoJSON files open directly in QGIS, ArcGIS, and MapInfo for professional spatial analysis. CSV exports work in Excel, Google Sheets, and any data tool. Every export includes full coordinates, category tags, comment text, timestamps, and vote counts — everything you need for reporting and further analysis.
FAQ
Frequently asked questions
Ready to map your community's feedback?
Give residents a voice tied to place. See exactly where concerns and ideas cluster across your consultation area. Start collecting location-based feedback with interactive consultation maps that residents actually enjoy using.
More features to discover